Categories
Categories report, is the drill-down report which provides you the key metrics and detailed behaviour of the sales from different categories as you defined in the category tree at the selected marketplaces and period.
You can click on a category from the category list table to view the details of the orders, units, and revenue for that particular category. You can also go back to the main page of the categories by clicking on the “categories” option displayed above the Total orders info card.
Sales
Click on this, to view the category wise sales of all the products sold in the selected time period.
Here is the list what you can get from the categories report,
- Units
- Revenue
- Category Sales Overview
- Categories list
- Estimated Net Profit
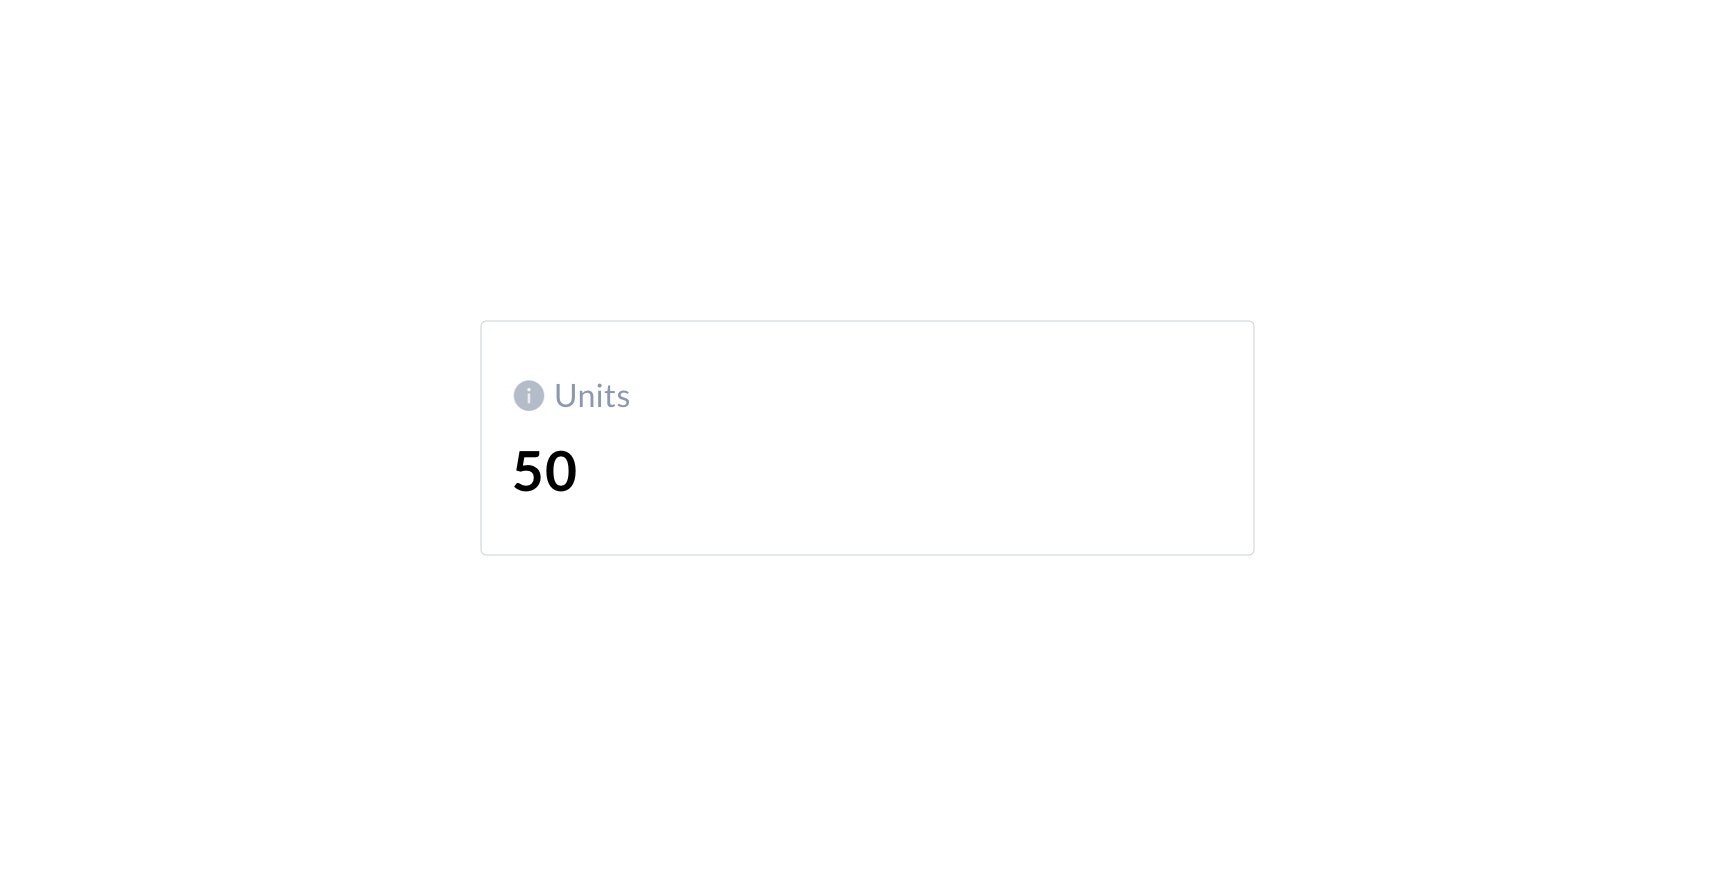
Units
It shows the total units count of shipped and pending orders of all products that comes under the category defined in the category tree at the selected marketplaces.
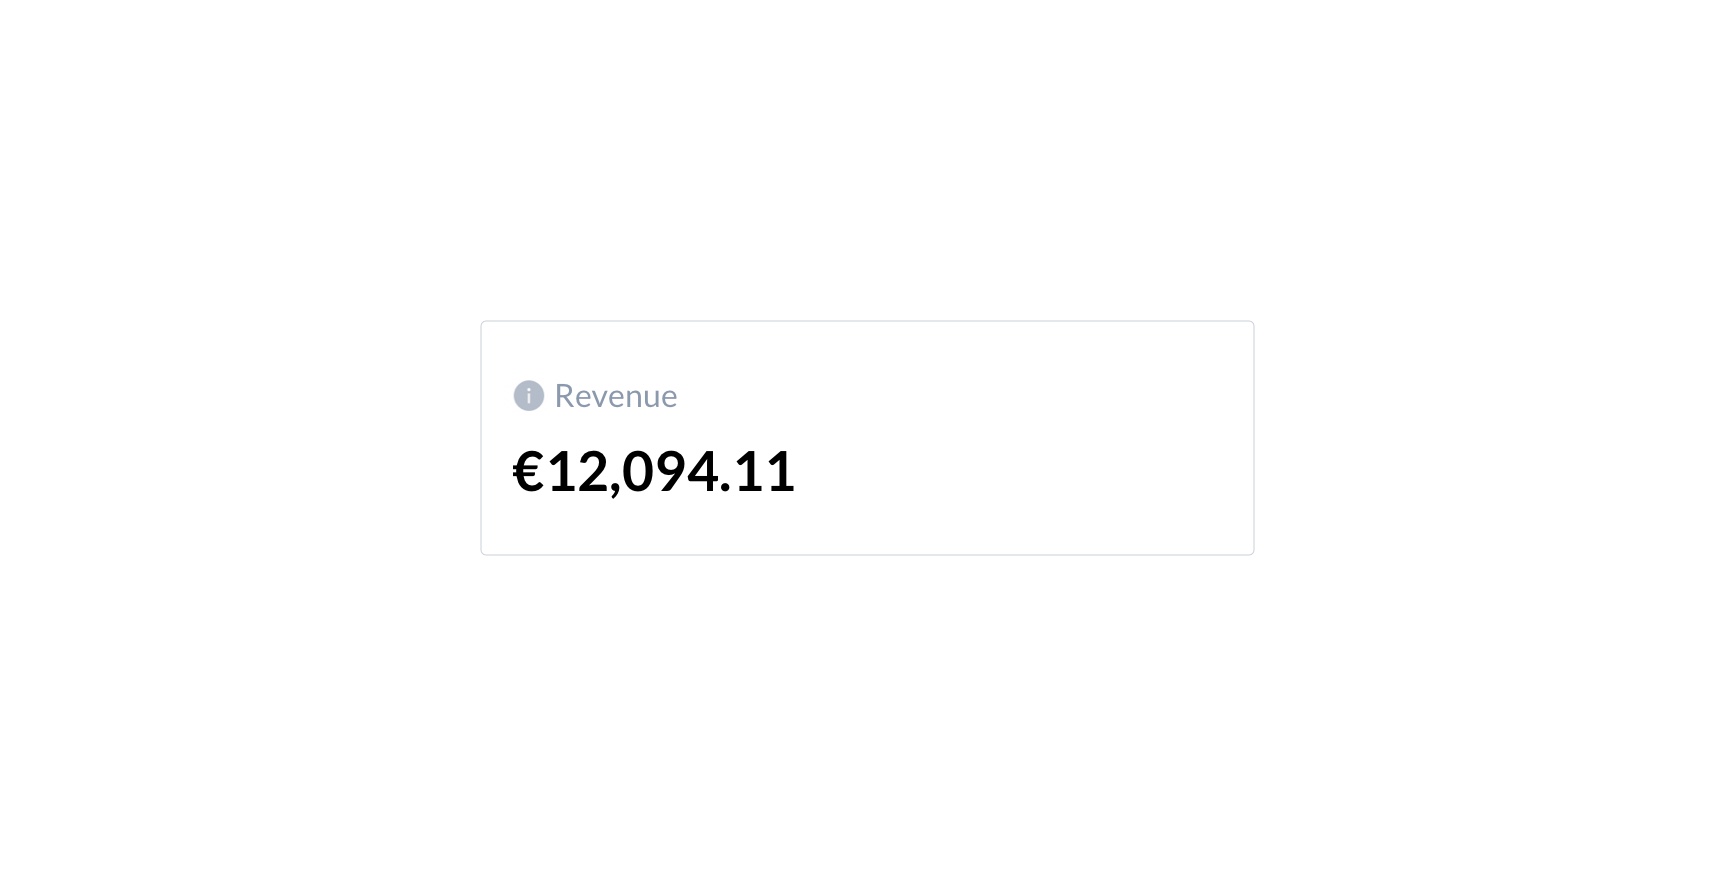
Revenue
It shows the total sales value amount approximately that is generated from all the sold units of all products, that comes under the category defined in the category tree at the selected marketplaces. The revenue will be shown in the currency which is selected in the company profile.
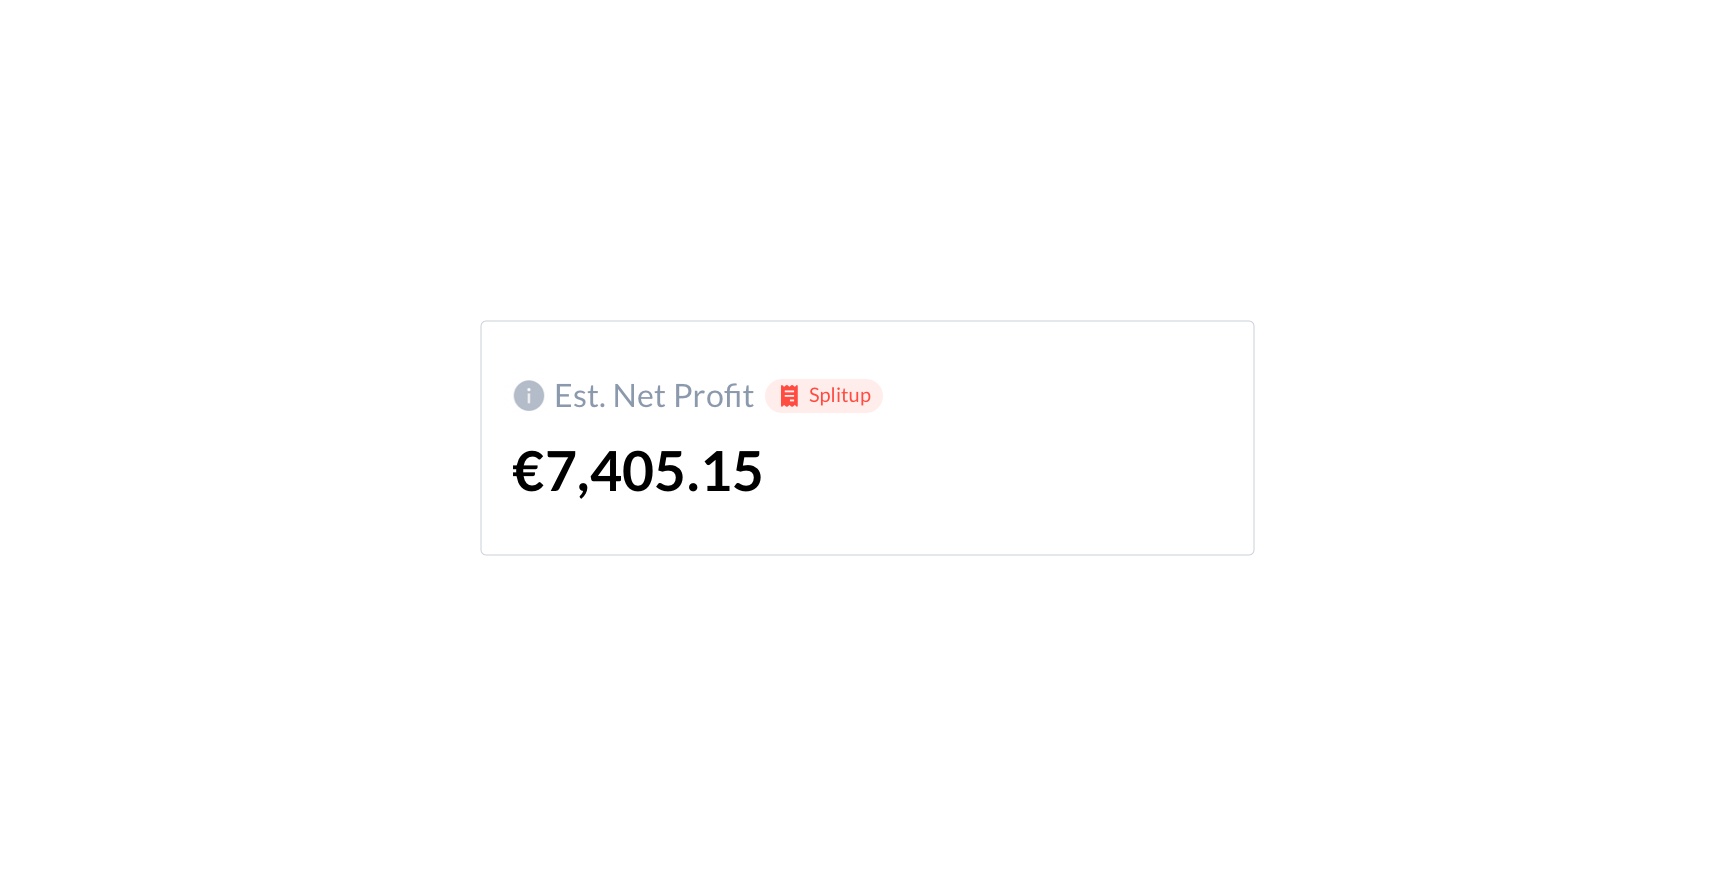
Estimated Net-Profit
This gives us the details about the estimated net profit of the concerned time period chosen. This financial split up is calculated using shipped orders only. The pending orders will be included here once they are shipped.
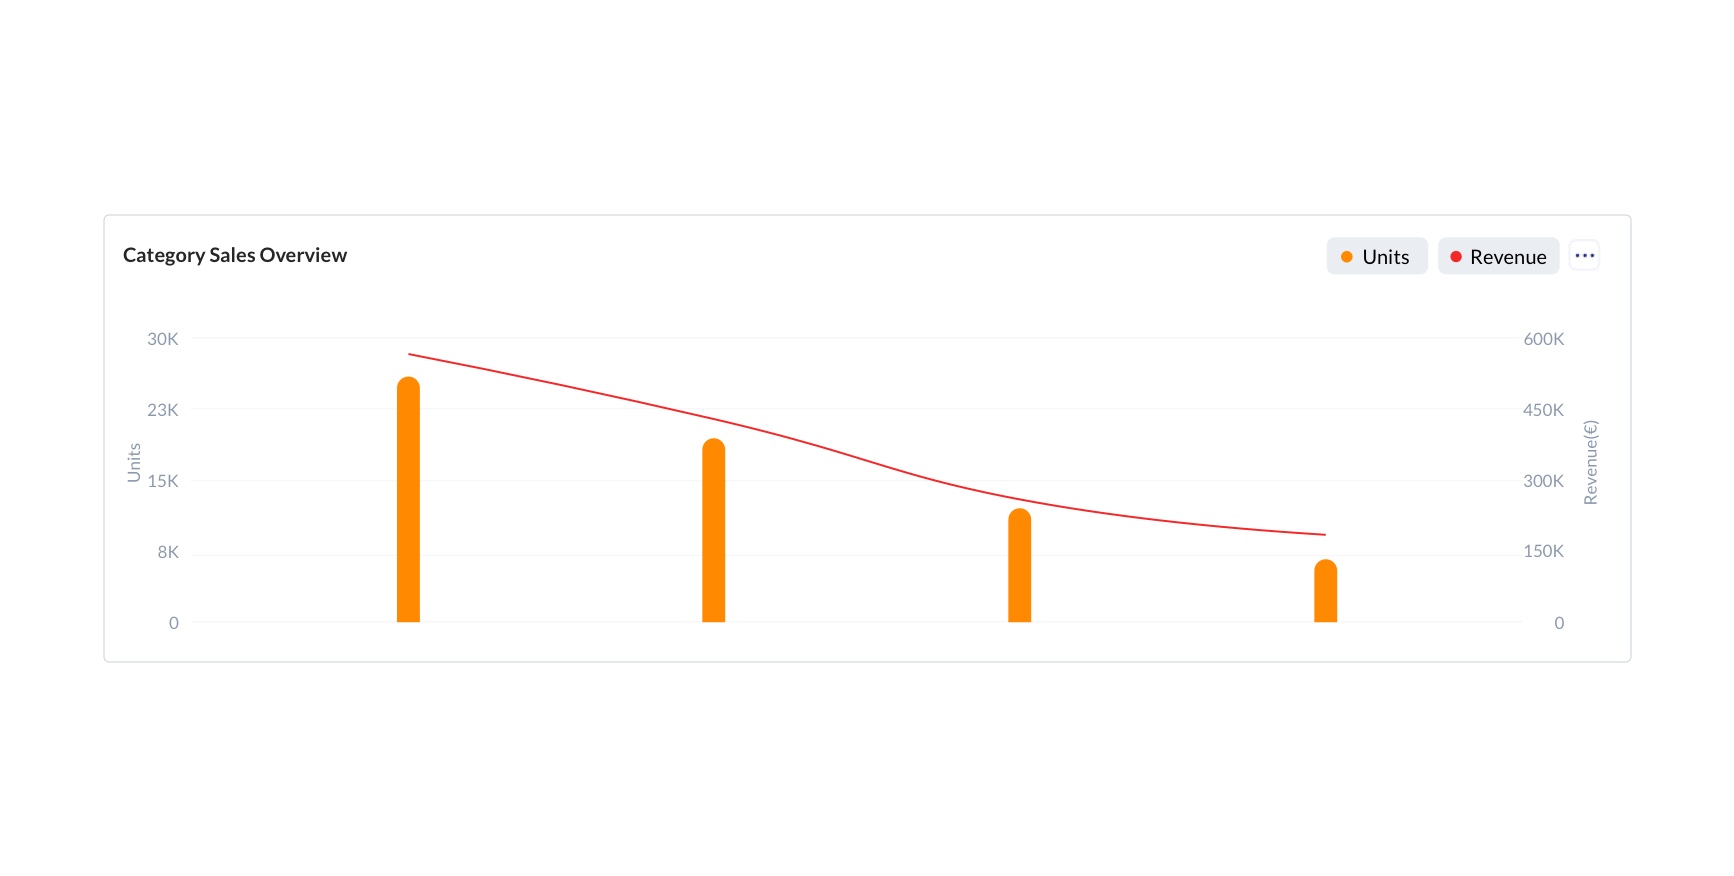
Category Sales Overview
You can view the chart based on either orders or units or revenue at a time. You can switch from Orders, Units, and Revenue from options provided in the chart. Detailed numbers of the purchased metrics in the currently selected periods, can be viewed on hovering over the lines in the charts. You will be having a trends icon getting displayed towards the extreme right end of the row. Clicking on this will give you the details about the trends nature of units and revenue.
Category Sales
These are the list of columns that are generated in the categories report table for Sales . Towards the top right corner of the table, we have the Export button. Clicking on this will display before you the available options with which you will be able to export the report details either by sending it as a mail or download it as a file. Clicking on the View Export status option will take you to the export option under the gear icon of the app. For more details on the Export status, please click here.
The categories columns are defined and there are no options provided to select the columns. They cannot be selected or unselected to display like other reports.
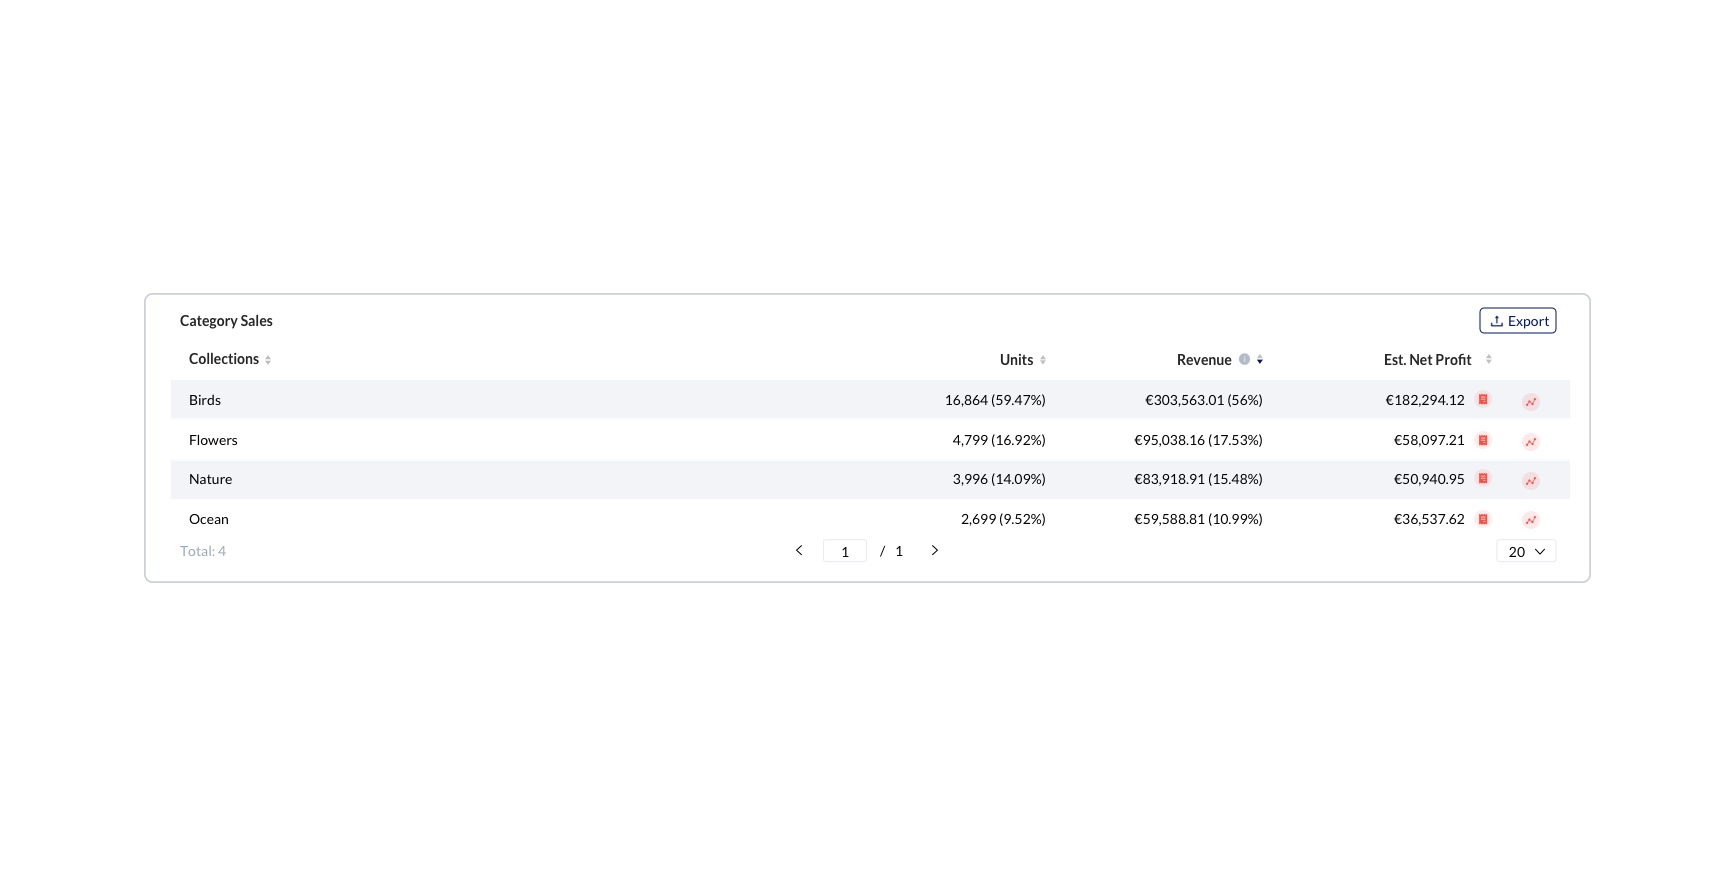
| Column Name | Description | Example |
|---|---|---|
| Category / Product | Name of category/Product at the selected marketplace | Hotel table cloths |
| Units | Total number of units purchased in all products under the category | 3 |
| Revenue | The approximate sales amount generated from all products under the category. It is indicated in the currency defined in the profile. | $100 |
| Estimated Net Profit | Will give the detailed view of the Estimated Net Profit with split-ups of Charges and Cost. Clicking on the info icon will display the details of the Estimated Net Profit | $97.75 |
Returns
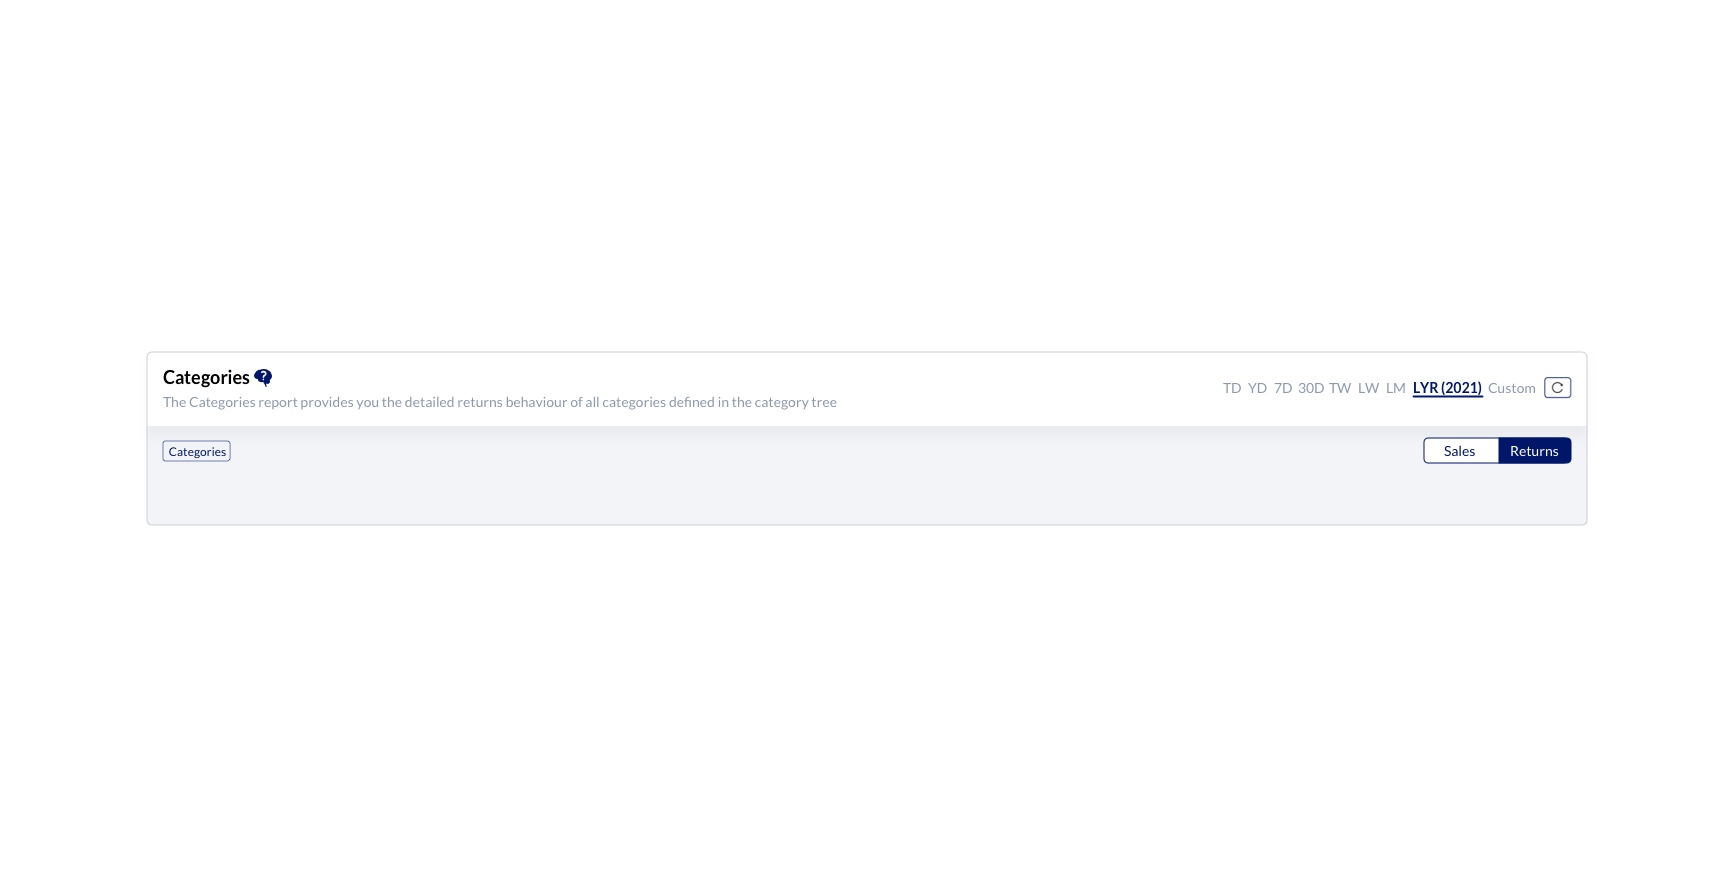
This section allows you to view the category wise details of all the products returned in the selected time period.
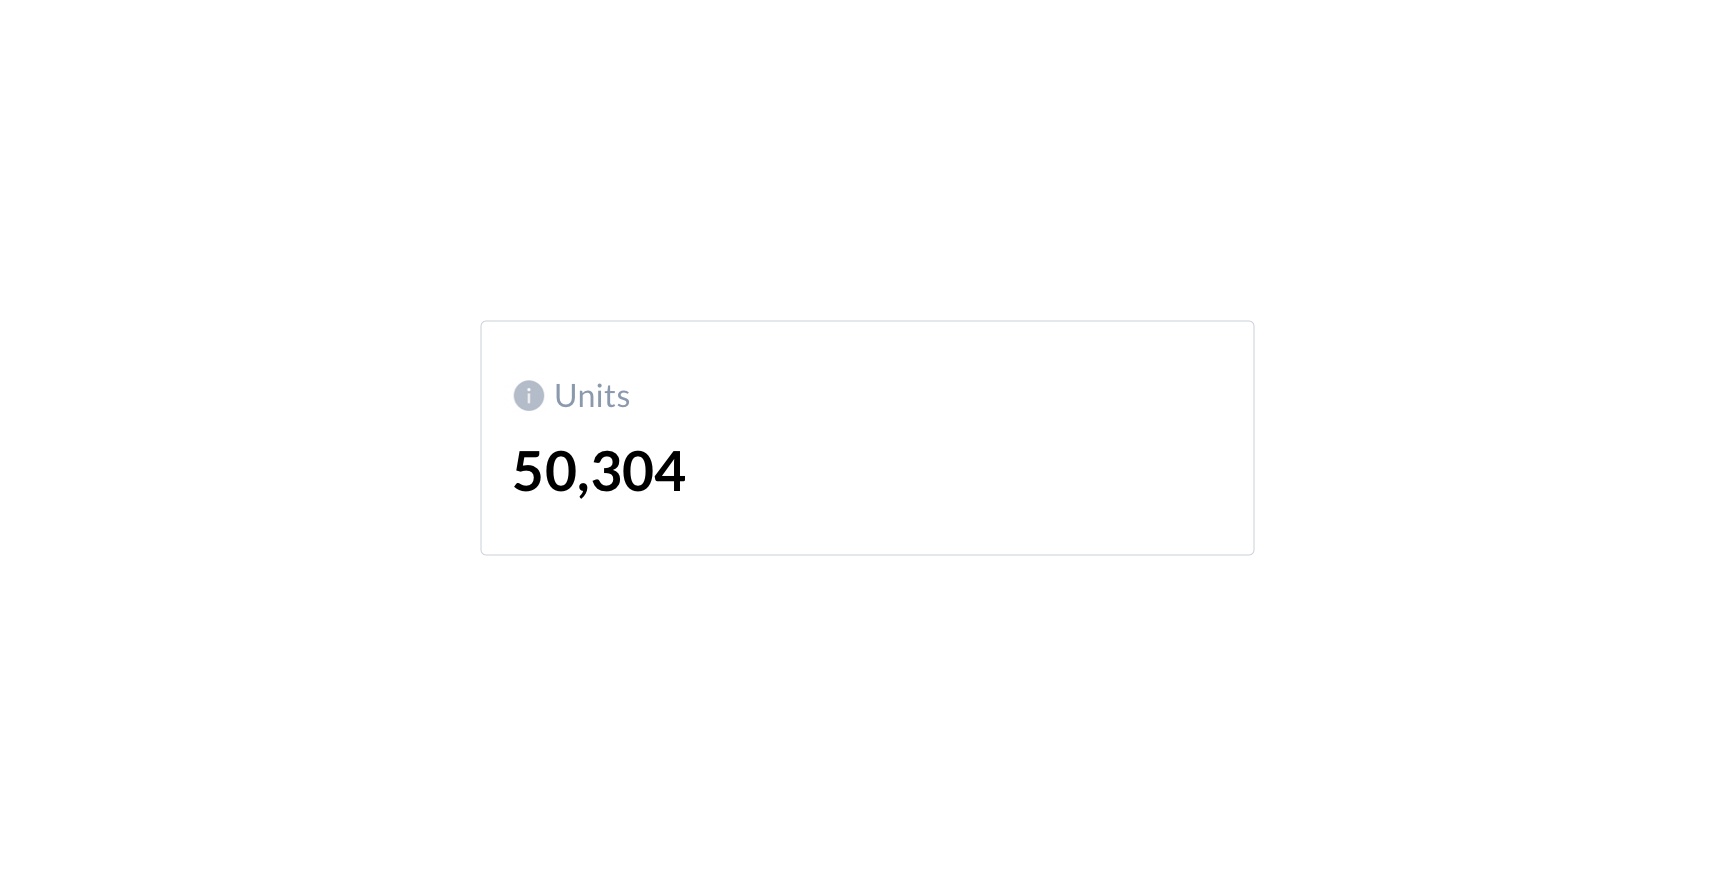
Units
Gives you the details about the total number of returned units, of all products that comes under the category defined in the category tree at the selected marketplaces.
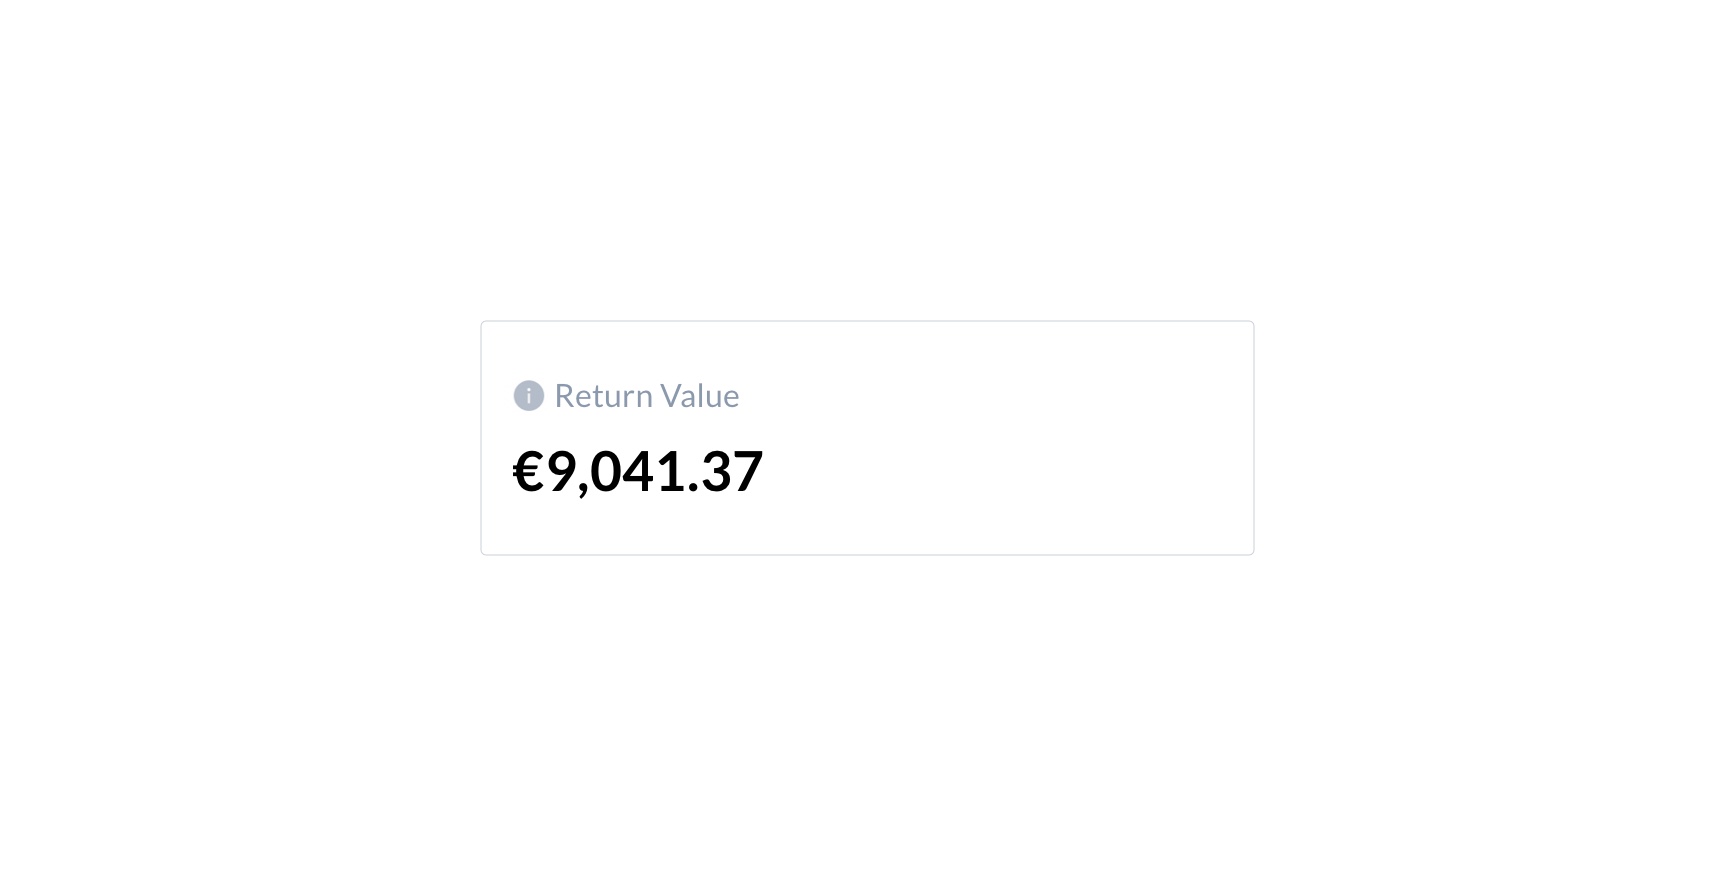
Return Value
Gives you the details about the total return value of all the products that comes under the category defined in the category tree at the selected market places
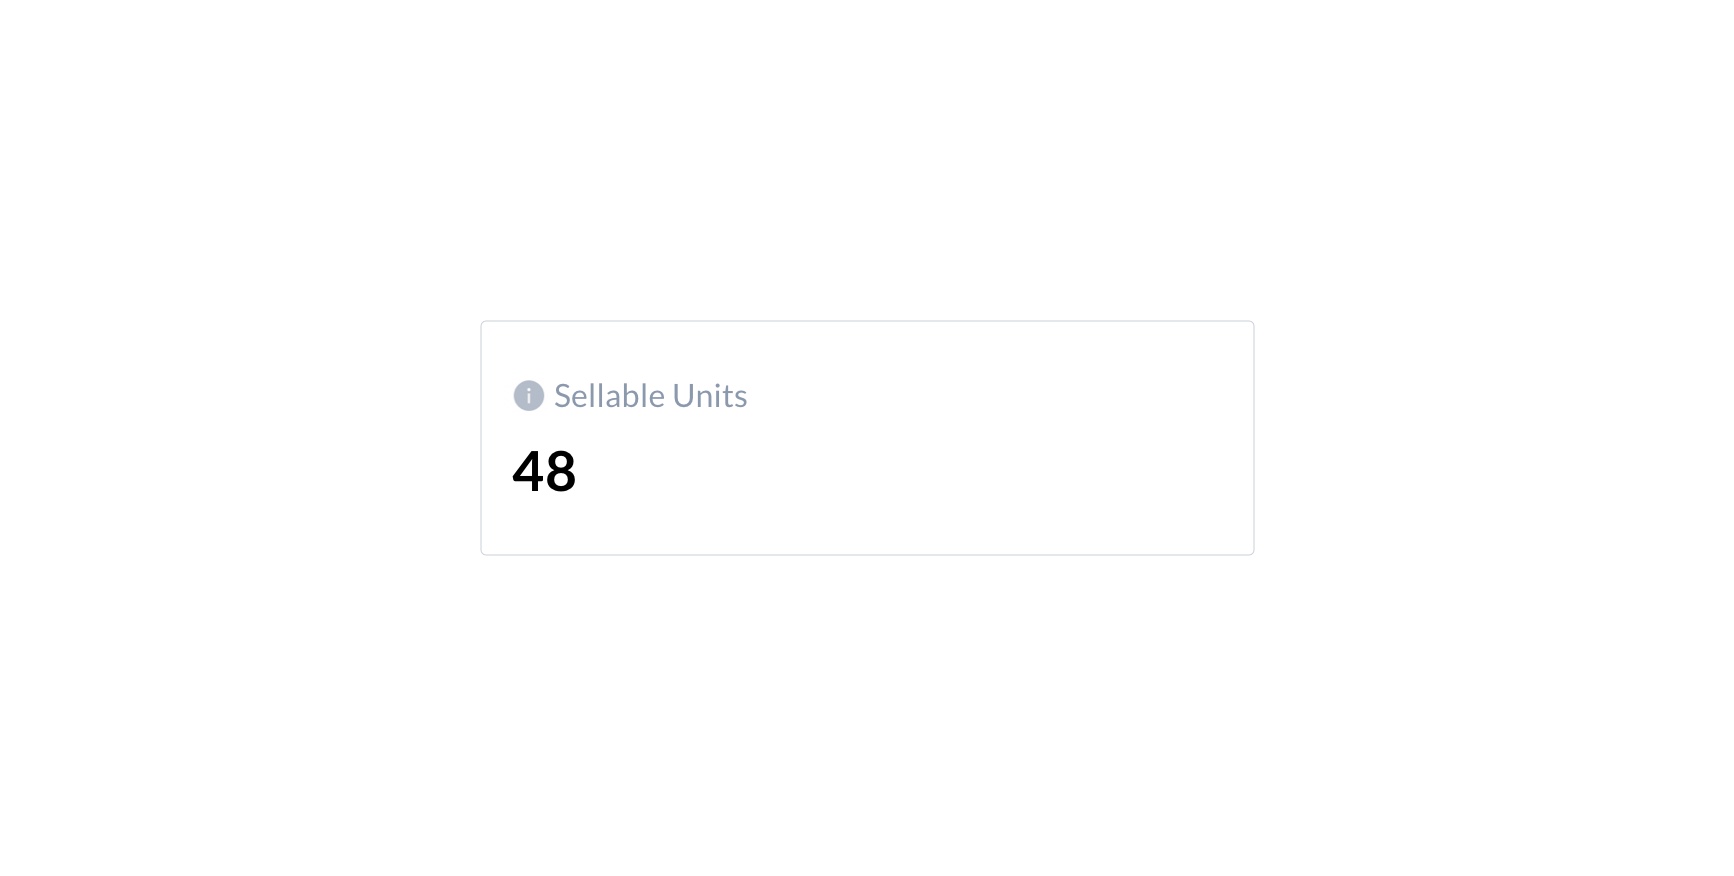
Sellable Units
Gives you the details about the total number of units that have been returned but are worth for reselling.
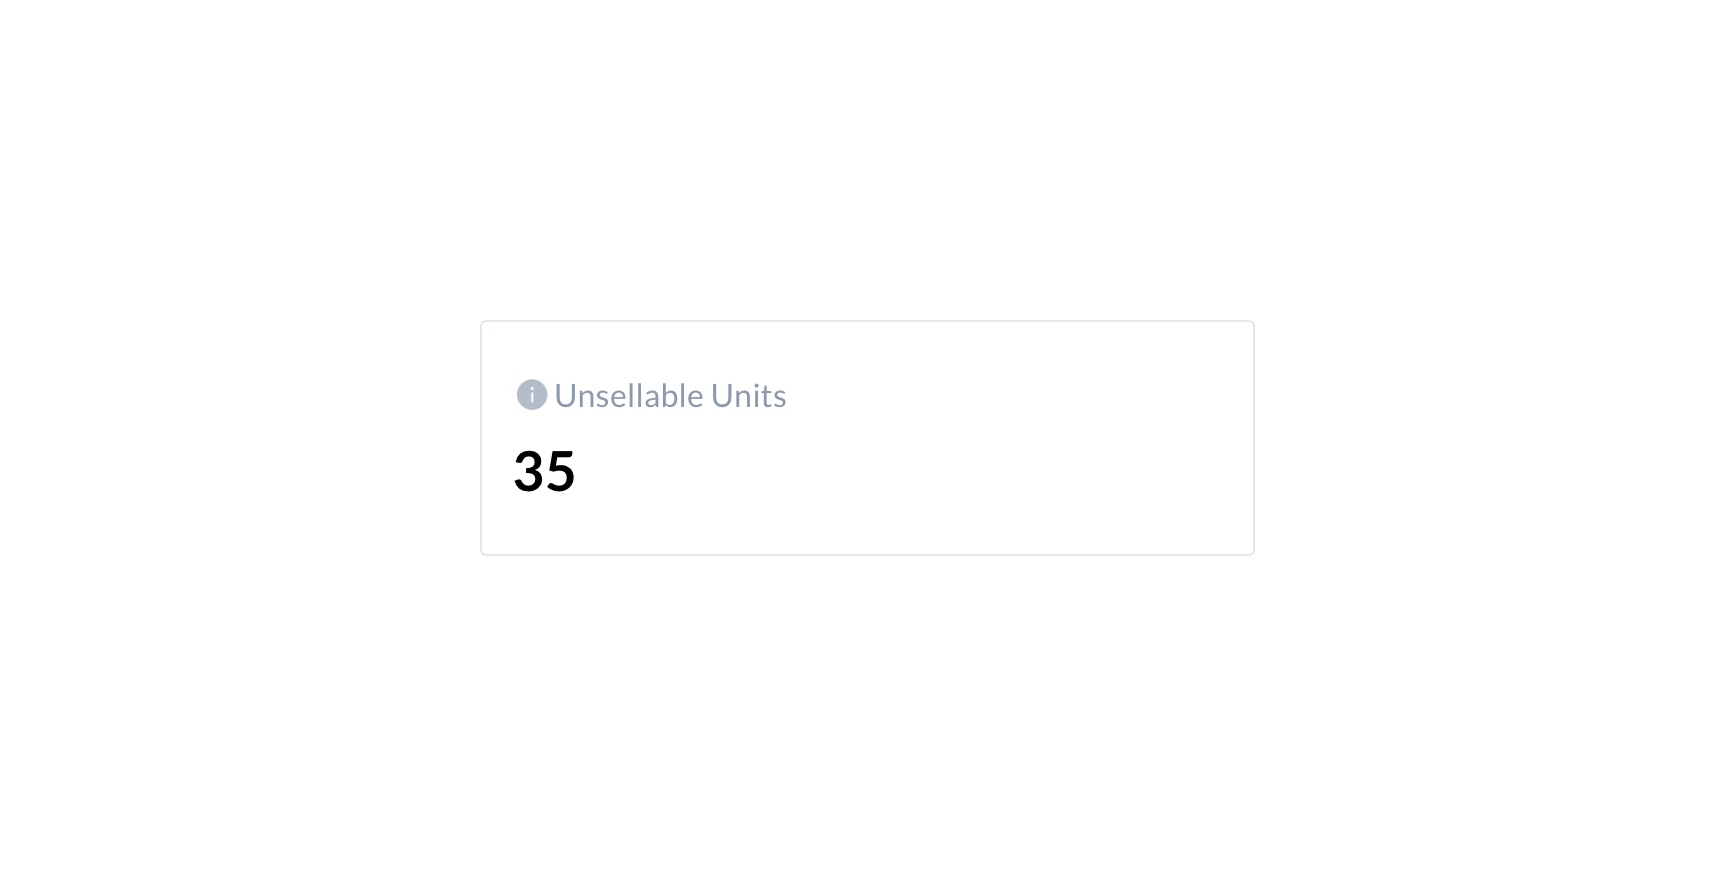
Unsellable Units
Gives you the details about the total number of units that have been returned by the buyers which are not worth for reselling.
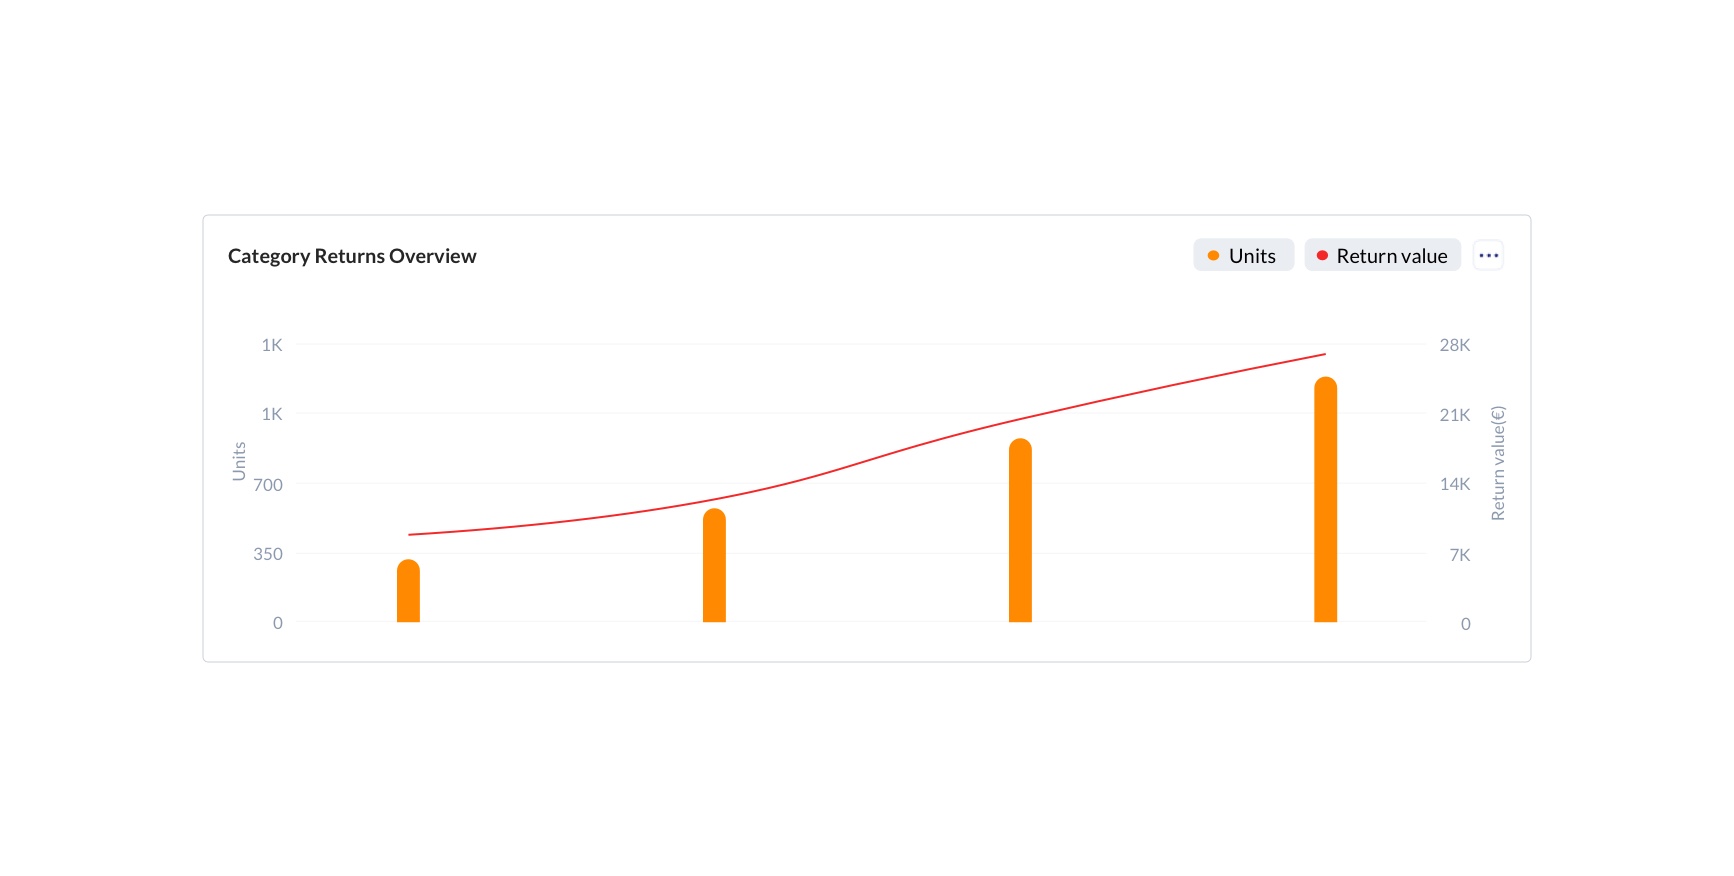
Category Returns Overview
Gives you the details about the units and return values for the selected date frame. You will be having a trends icon getting displayed towards the extreme right end of the row. Clicking on this will give you the details about the trends nature of units and return value.
Category Returns
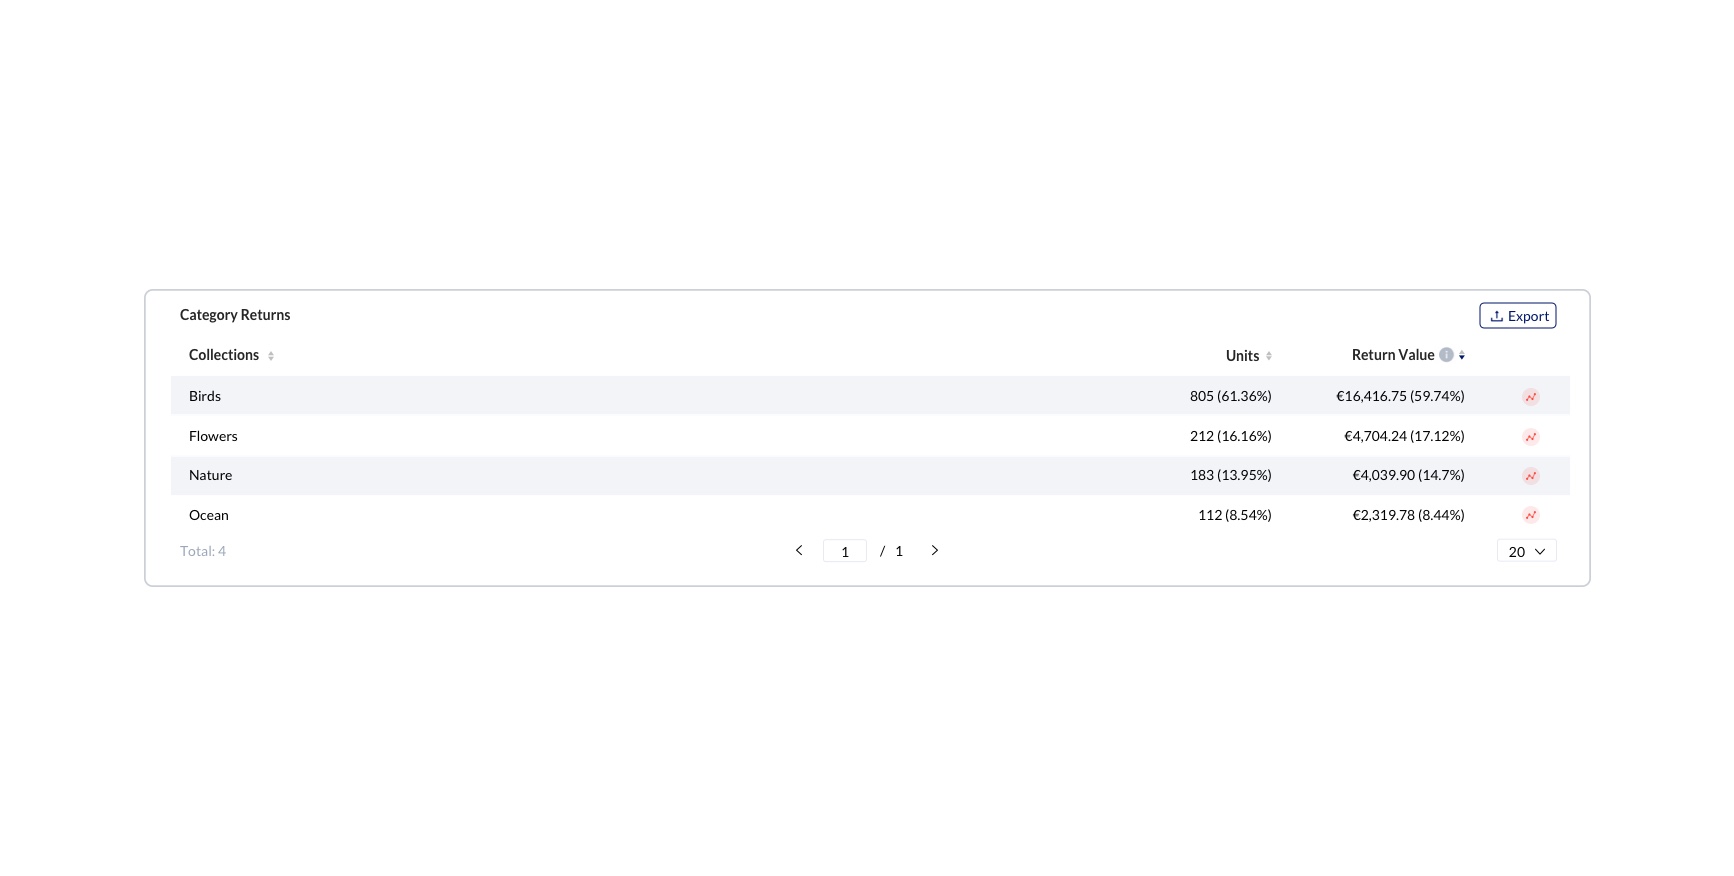
| Category | The defined categories will be listed |
|---|---|
| Units | Total number of Units |
| Return Value | Return Value for the concerned category |